AI Recommendations Change Almost Every Time You Ask. Track This Instead.
Temperature zero does not make a model deterministic. Here is what actually causes the churn, what the 2026 studies measured, and which four numbers survive it.
Companion film
Four mechanisms that temperature zero does not fix
The churn shown as churn: brand lists that never repeat, and what is actually producing them.
1:18captionsthe same scan as the screenshots below
Read the transcript insteadHide the transcript
0:01Ask an assistant for the best tool in your category. Then ask again. You'll usually get a different list.
0:08SparkToro ran 2,961 prompts through ChatGPT, Claude and Google's AI answers. The same brand list came back under 1% of the time. The same list in the same order: under one in a thousand.
0:23And temperature zero does not fix this. Floating-point addition isn't associative. Mixture-of-experts models route differently depending on who else is being served. Hosted endpoints don't guarantee a seed.
0:37Grounded probing adds one more: the live web. A perfectly deterministic model would still answer differently, because the sources moved.
0:46Citations churn on a slower clock. Forty to 60% of cited domains change month over month. The average source has a citation half-life of about three and a half weeks.
0:59So track the four things that survive. A rate with an interval. Prominence averaged over repeats. The consideration set, not the ranking. And volatility itself, scored.
1:11Stop screenshotting rank. Start measuring range. whereamimentioned.com.
Ask an assistant "best CRM for a small agency" twice and you'll usually get two different lists. Most people put this down to phrasing, or assume a temperature: 0 setting would fix it. Neither holds, and the effect is larger than almost anyone guesses.
What the 2026 studies actually measured
SparkToro, working with Gumshoe.ai, had volunteers run 2,961 prompts through ChatGPT, Claude and Google AI Overviews across categories from chef's knives to cancer-care hospitals, each prompt run 60 to 100 times per platform. Their findings:
- ChatGPT and Google AI Overviews each returned the same brand list under 1% of the time.
- The same list in the same order: under 0.1%.
- Nearly every response differed in three ways at once: which brands appeared, in what order, and how many.
Citations churn on a longer clock but just as thoroughly. Profound's analysis of 240 million ChatGPT citations found 40–60% of cited domains change month over month for identical queries, and 70–90% over six months. Profound has not published the raw study, so that one reaches us through a write-up of their data rather than a primary paper; weight it accordingly. The decay figures are firmer: Scrunch and Stacker measured 3.5 million citation events across 120,000 domains and put the median citation half-life at 4.5 weeks, splitting to 3.4 weeks on ChatGPT and 5.7 weeks on Perplexity.
So: the brand list churns run to run, and the source list churns month to month. Any AI-visibility number that ignores either one is reporting a single frame from a moving picture.
Why temperature zero does not save you
Four independent mechanisms, and setting temperature to zero only addresses the first.
Sampling. At temperature above zero the model draws from a probability distribution over the next token. Set it to zero and it takes the most likely token every time. This is the part people know about, and it's the smallest part.
Floating-point non-associativity. (a + b) + c doesn't always equal a + (b + c) in floating-point arithmetic. GPU kernels sum values in whatever order the batch scheduler produces, and that order depends on what else is in the batch, which is to say on other users' traffic. Tiny differences in logits flip a close decision between two tokens, and one flipped token early in a list changes everything after it.
Mixture-of-experts routing. Large models route each token to a subset of experts. In batched inference, routing decisions depend on batch composition, so the same prompt takes a different path through the network depending on who else is being served.
Server-side seeds. Hosted endpoints treat seed as best-effort at most. Even where a seed parameter exists, providers won't guarantee it pins the whole stack across deployments.
Grounded probing adds a fifth: the live web. If the retrieval step returns different sources this hour than last hour, a perfectly deterministic model would still produce a different answer. That's the point of grounding rather than a fault in it. You want to measure the web as it is, and the web moves.
One controllable factor does help. Output length drives instability harder than almost anything else: the longer the answer, the more chances for a divergence to compound. Capping max_tokens and pinning temperature to zero meaningfully narrows the spread, which is why our probes do both, and then repeat anyway, because narrowing variance still leaves variance.
The obvious wrong response: run it again until it agrees with you
Instability creates a specific temptation. Run the prompt, dislike the answer, run it again, screenshot the good one. Every number produced this way is fiction, and the same trap catches vendors: a single-shot scan that happens to catch a favourable draw produces a flattering report with no way to tell it apart from a real improvement.
The correct response is the one polling settled on decades ago. Stop treating each answer as a verdict. Treat it as one draw from a distribution, sample enough draws to estimate the distribution, and publish the uncertainty alongside the estimate.
The four numbers that survive the churn
1. A rate, with an interval. Not "we rank third" but "we appear in 26.7% of answers, 95% CI 10.9%–52.0%". Individual answers are noise; the rate is signal. The interval tells you how much signal.
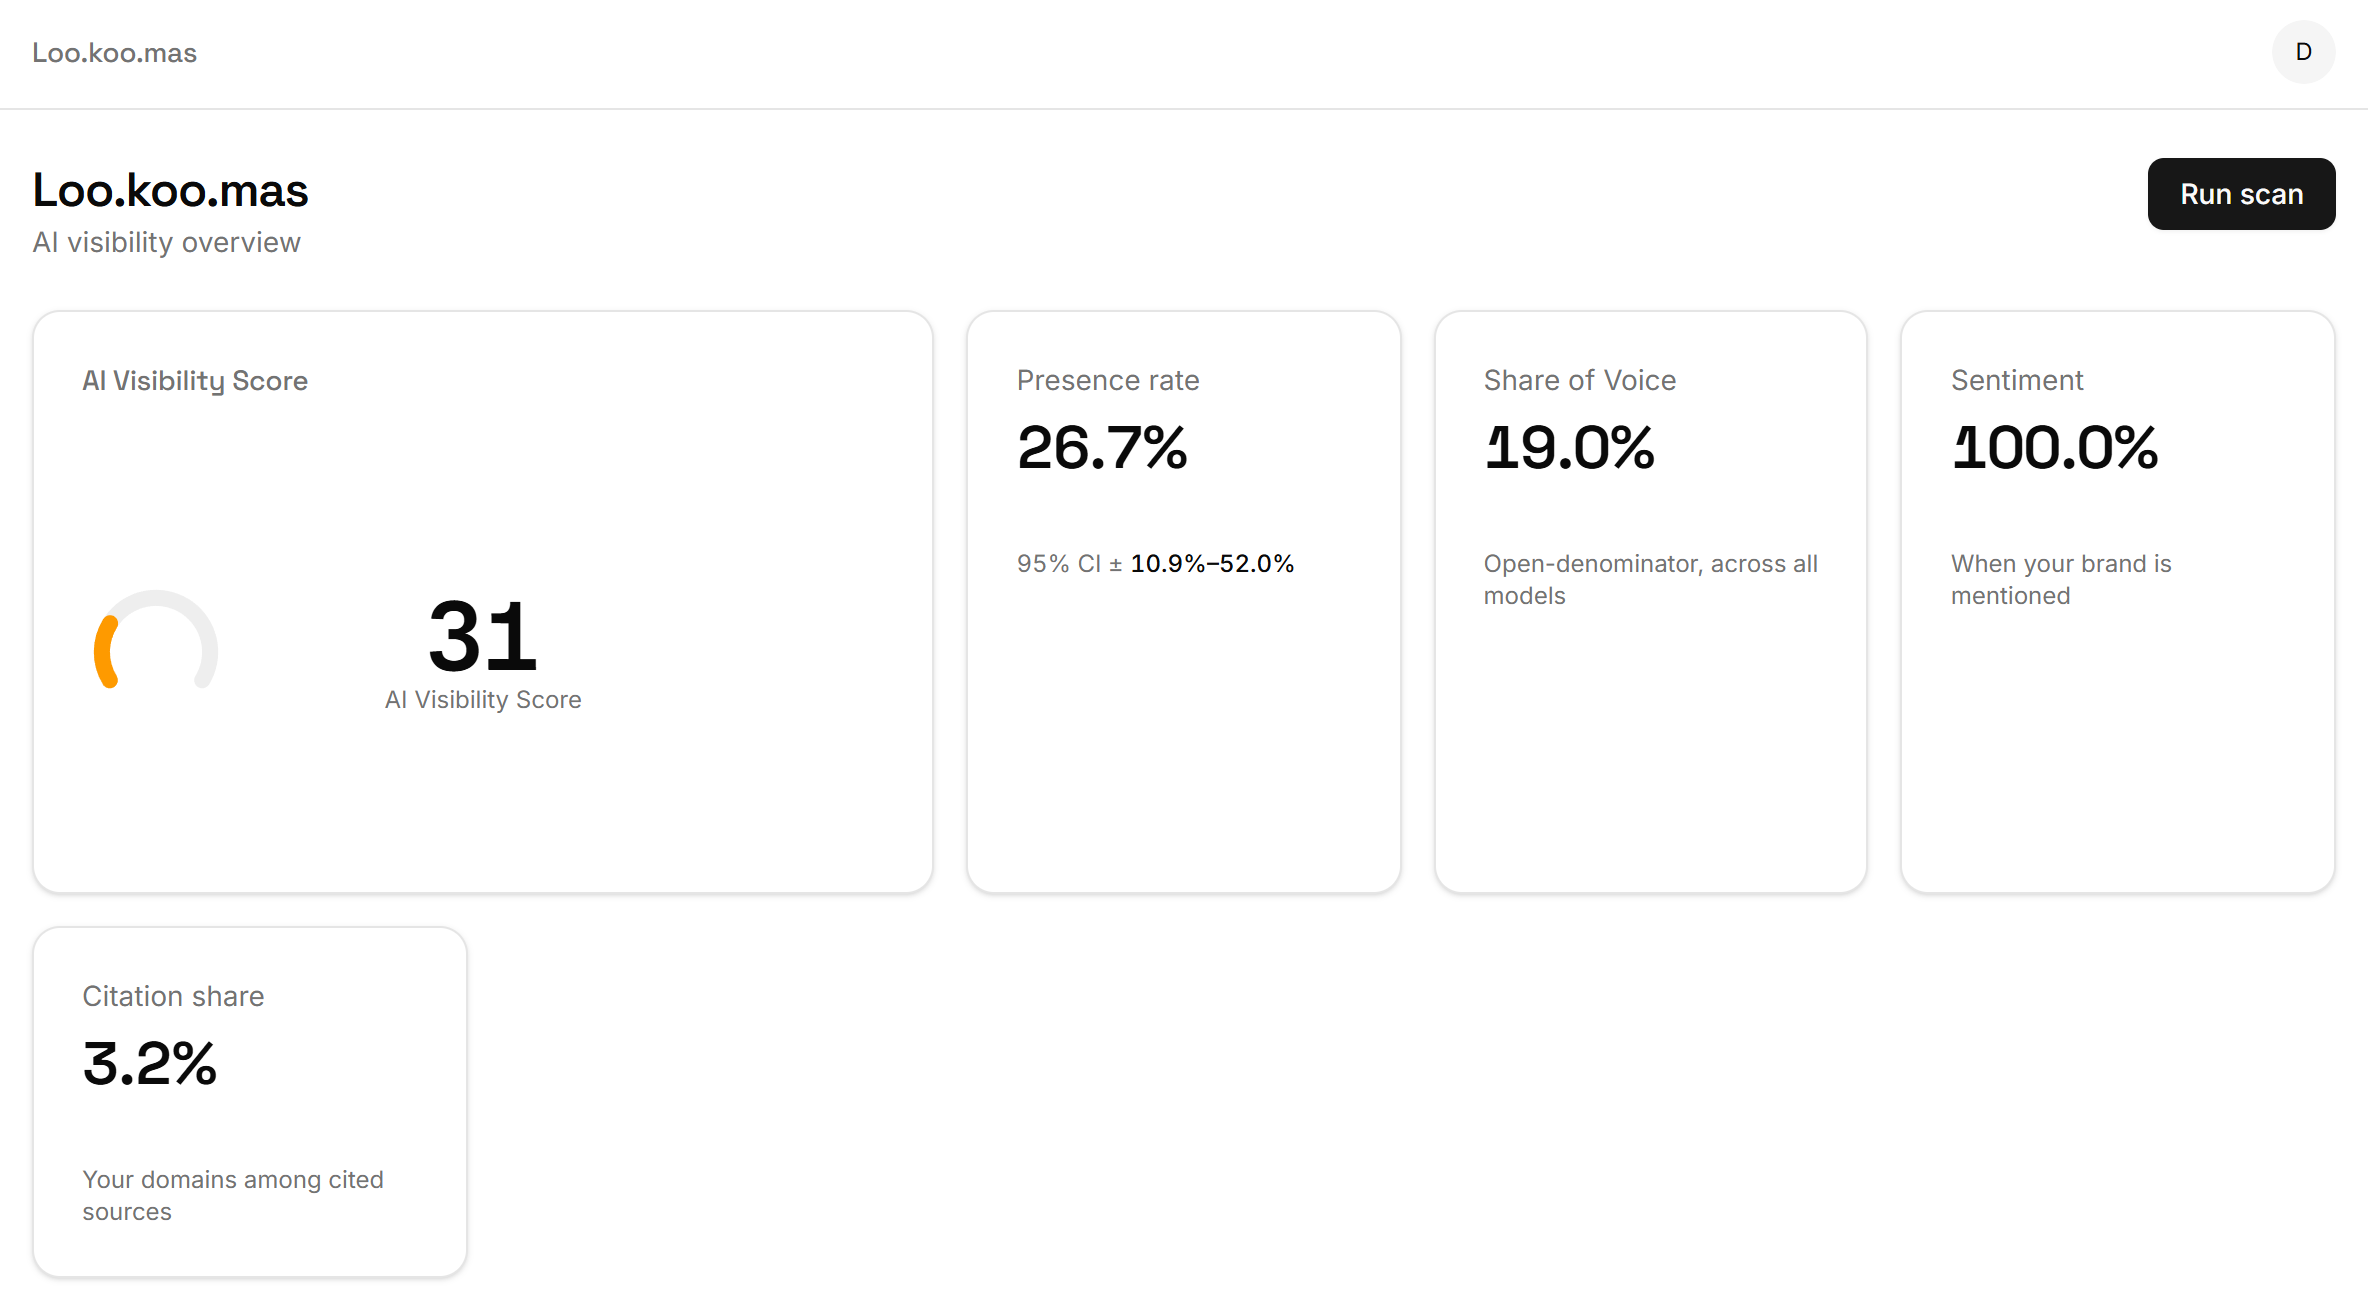
2. Average prominence, over repetitions. Position within a single answer is nearly random between runs. Averaged across enough repetitions it becomes a real quantity: where you typically land. Position-weighted Share of Voice, which discounts lower placements, only becomes trustworthy at five or more runs per prompt; below that it amplifies randomness instead of measuring it. So it stays gated behind higher repetition counts instead of being on by default.
3. The consideration set, not the ranking. The stable thing in an unstable system is which brands are in the pool at all. Run enough answers and a category's membership becomes clear even while the ordering never repeats. That's what an open-denominator Share of Voice measures: everyone the models actually name, discovered from the answers.
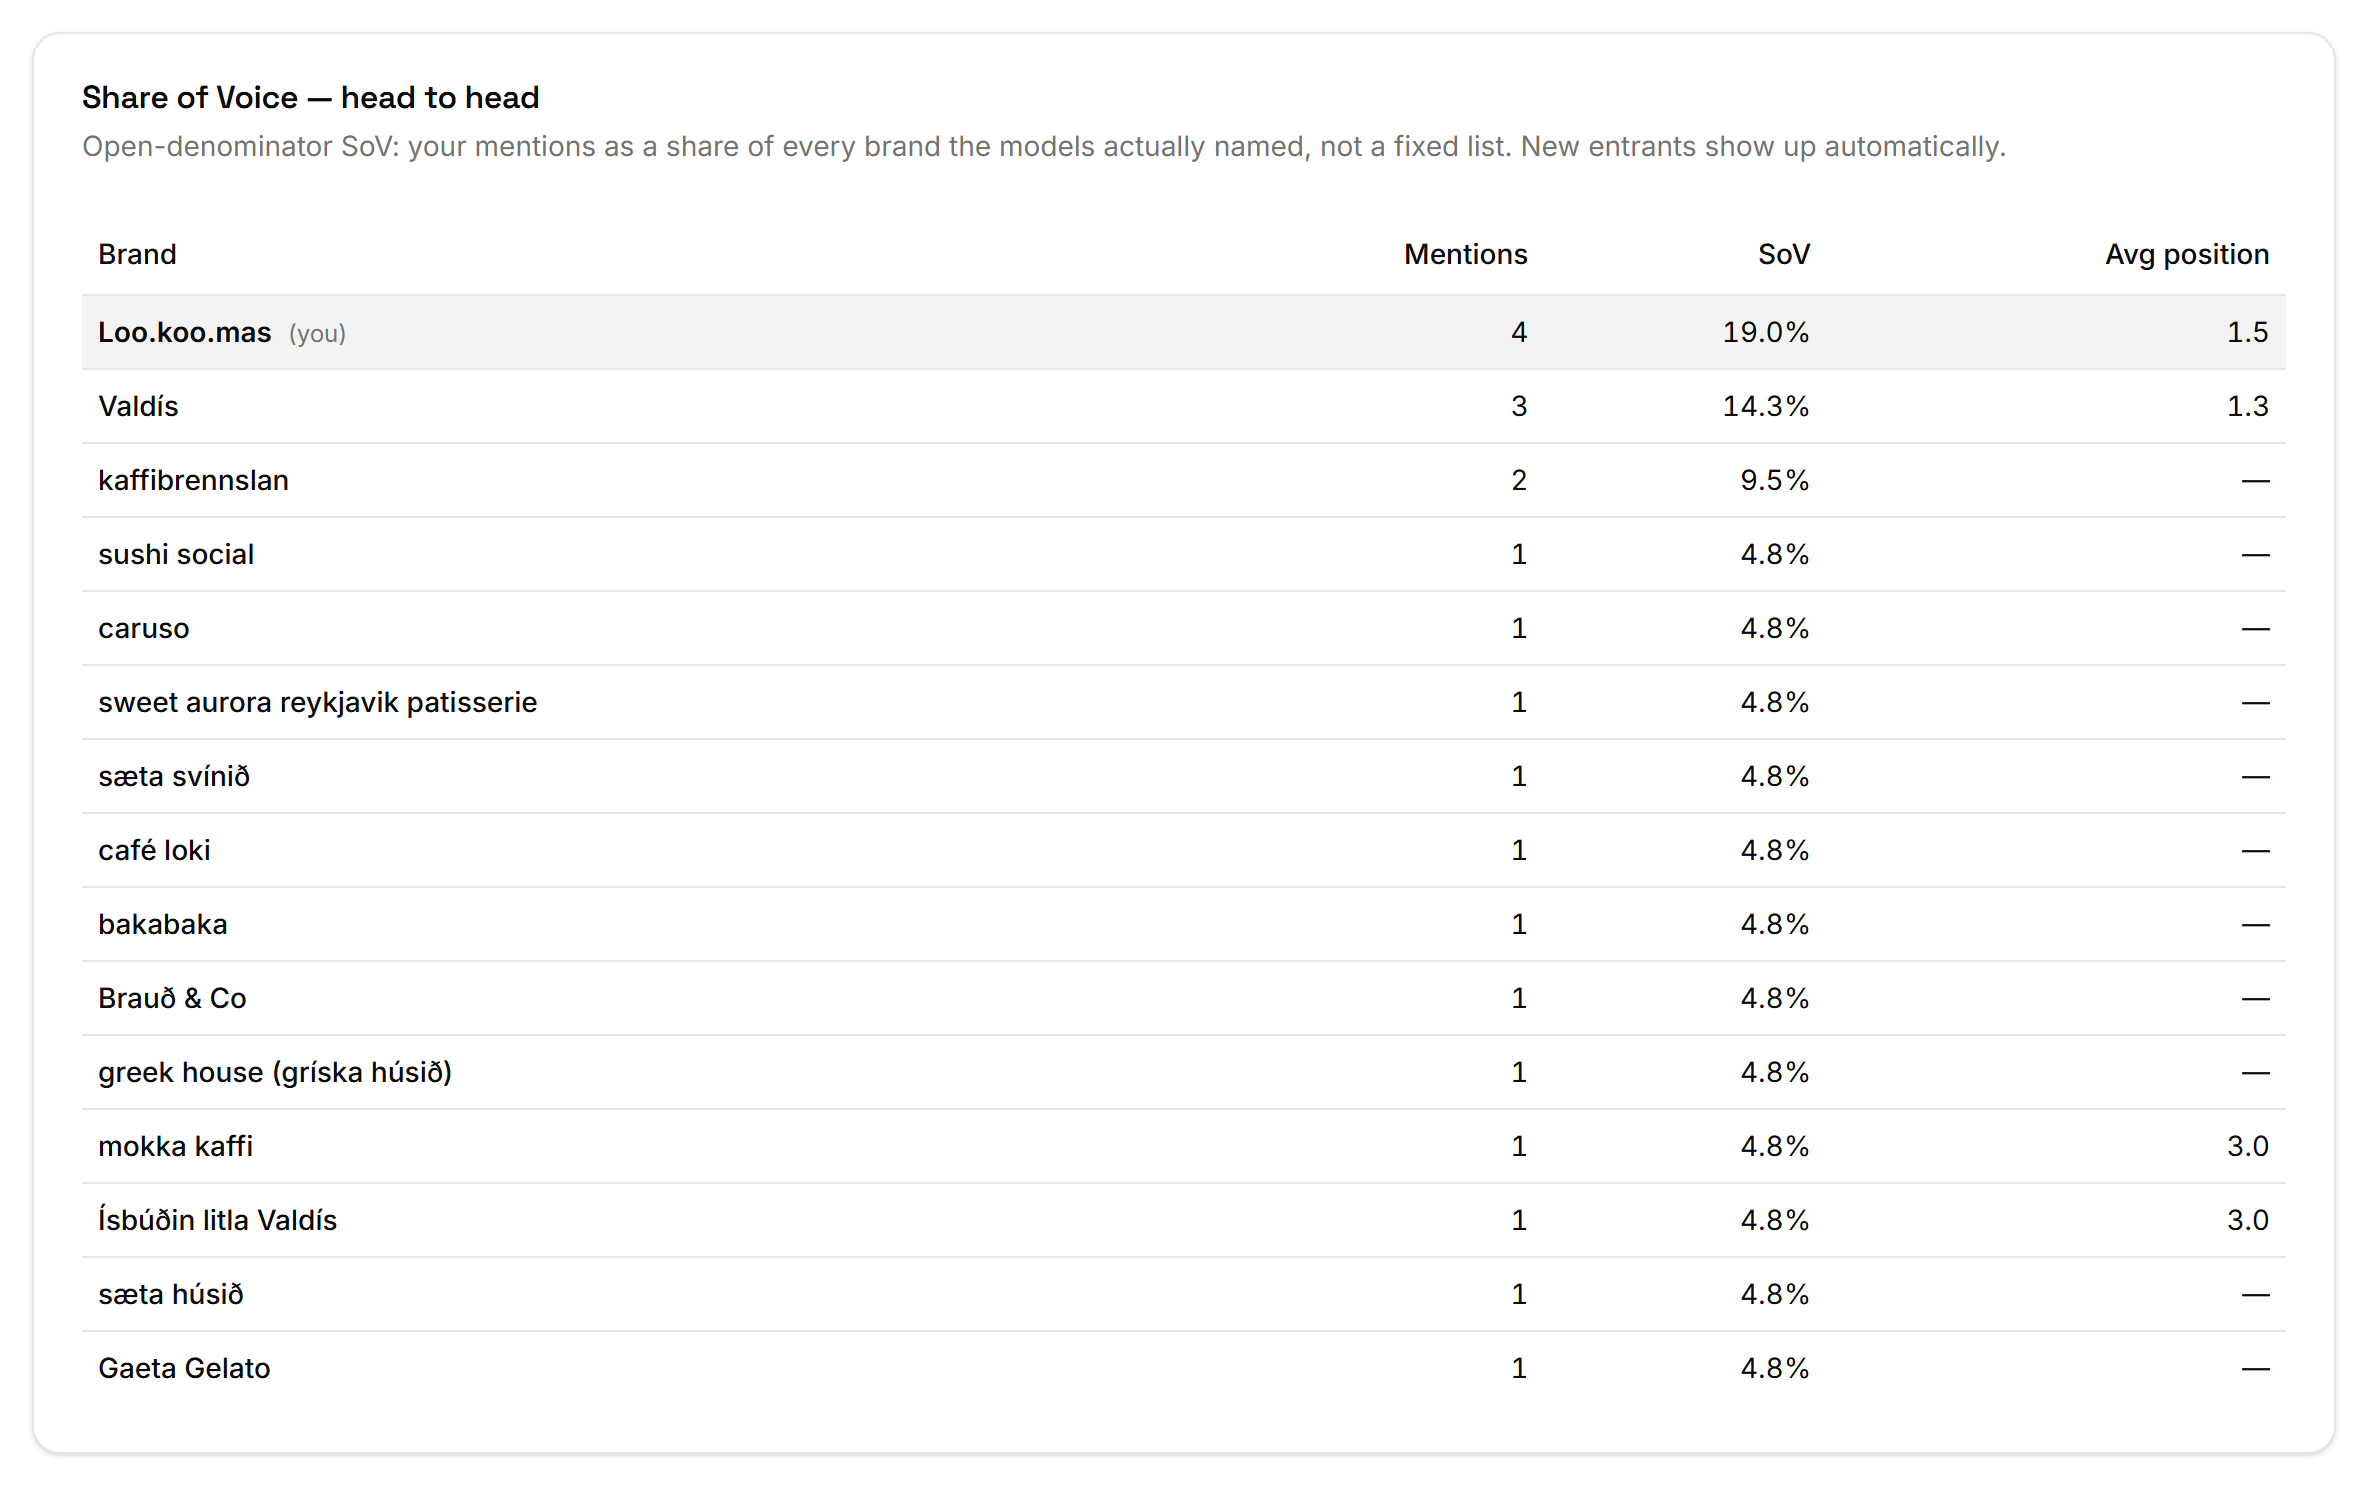
Loo.koo.mas holds 19.0% of mentions in its category. The next brand, Valdís, holds 14.3%. Below that, twelve more brands sit at 4.8% each: one mention apiece, indistinguishable from each other and from noise. The top two are a finding. The tail is a list of things that were said once.
4. Stability itself, as a metric. If volatility is the defining property of the medium, it belongs in the score instead of in a caveat. Stability is computed as 1 − (Wilson half-width ÷ point estimate) and carries 0.05 weight in the composite, so a brand whose presence swings run to run can't score like one that appears reliably. In our demo scan two of three engines score 0.00 on stability: with five answers each, the interval is as wide as the estimate. That zero is informative. It says you haven't bought enough observations to know. How the composite is assembled works through the arithmetic.
Engines disagree more than runs do
There's a second axis of variance that repetition can't reach, and it's bigger.
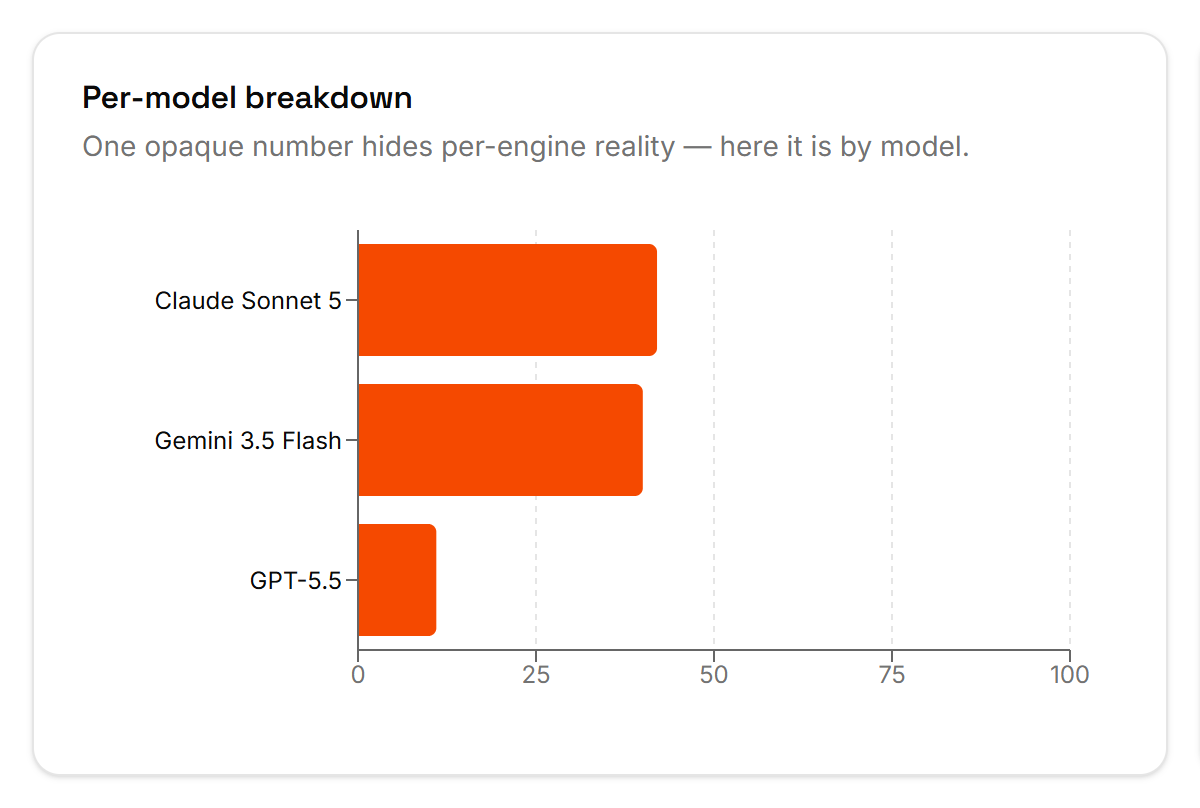
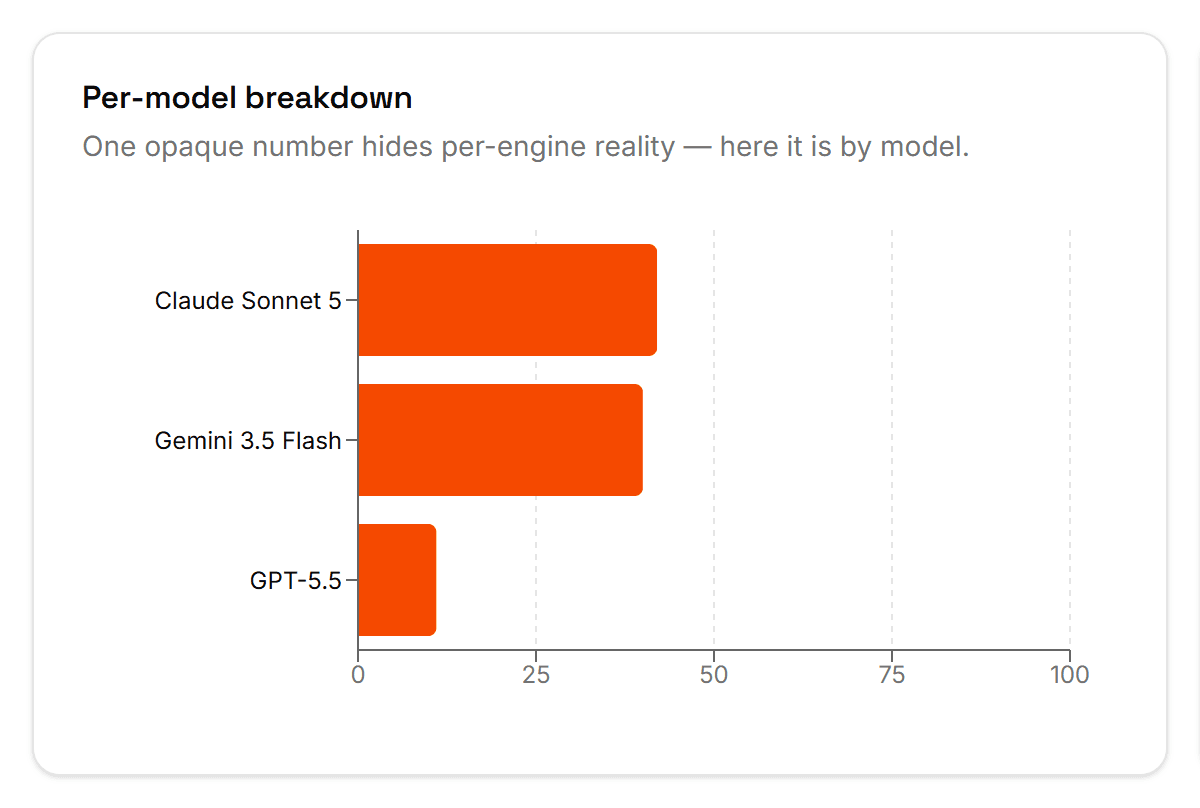
Same brand, same five questions, same day. GPT-5.5 scored 11. Gemini scored 40. Claude scored 42.46. A four-fold spread between the best and worst engine, from data collected within minutes of itself.
No number of re-runs on a single engine would have revealed that. It's why the panel is multi-engine by default, and why the headline blends per-engine scores instead of pooling them. Pooling would have quietly averaged GPT-5.5's near-invisibility into a number no user of any single engine experiences.
What to do differently on Monday
- Never report a rate without its interval. A tool that shows bare percentages is hiding the only number that tells you whether to act.
- Set an alert threshold from the confidence band, not from a round number. A "10% drop" alert on a scan with a ±20-point interval will fire constantly and mean nothing. Treat a change as real only when the two scans' intervals stop overlapping.
- Re-scan on the drift clock, not the reporting clock. With 40–60% monthly turnover in cited domains, monthly is a defensible floor for citation work. Weekly scanning with a sample too small to clear its own interval buys noise at a higher price.
- Stop screenshotting rank. One run's ordering is close to a coin flip. If you need to show placement, show averaged prominence across repetitions and say how many.
- Split by engine before you draw any conclusion. An 11 and a 42 averaged into a 31 describes a brand that doesn't exist.
The uncomfortable implication of the SparkToro numbers is that a great deal of AI-visibility reporting circulating right now is measurement error presented as insight: single runs, single engines, bare percentages, month-over-month deltas smaller than the noise floor. None of that argues for measuring less. It argues for measuring the way people measure everything else that refuses to hold still.
FAQ
Does setting temperature to zero make AI answers repeatable? It reduces variance without removing it. Floating-point addition isn't associative, so the order in which a batched GPU kernel sums values changes the result slightly; mixture-of-experts models route tokens differently depending on batch composition; and hosted endpoints won't guarantee a fixed seed. Grounded probes add another layer, because the live search results themselves change.
If answers are this unstable, is AI visibility measurable at all? Yes, as a rate rather than a ranking. Individual answers are draws from a distribution, and the distribution is stable enough to estimate. It's the same situation as political polling, which is unreliable per respondent and useful in aggregate with a stated margin of error.
Should I track my rank position in AI answers? Not as a single-run figure. Ordering is close to random between runs (SparkToro found identical lists in identical order under 0.1% of the time), so a rank from one run carries almost no information. Averaged prominence over five or more repetitions is meaningful; a rank screenshot isn't.
How often should I re-scan? Match the cadence to the drift you're trying to catch, not to a reporting calendar. Published analyses put month-over-month cited-domain turnover at 40–60%, so monthly is a reasonable floor for citation work. Scanning weekly with a sample too small to clear its own confidence band just buys more noise.
Corrections and updates
What changed after publication, and why. An article that argues for showing your working does not get to edit itself quietly.
- Added the source links behind the Profound and Scrunch/Stacker figures, and flagged that the Profound number reaches us through a write-up rather than a published study. No figures changed.