How Many Prompts Do You Actually Need to Measure AI Visibility?
The margin of error is 0.98 ÷ √(prompts × models × runs). That one formula settles most arguments about prompt-set size, including why 97 runs of one prompt is a waste.
Companion film
97 runs of one prompt buy less than 25 prompts run once
The sizing formula drawn out: what fifteen observations buys, and what 540 buys.
1:12captionsthe same scan as the screenshots below
Read the transcript insteadHide the transcript
0:01How many prompts do you need to measure AI visibility? One formula settles most of the argument.
0:07Your margin of error is 0.98, divided by the square root of prompts times models times runs. That's it. Everything else follows.
0:17Five prompts across three models is fifteen observations, give or take 25 points. Thirty prompts, six models, three runs is 540, give or take 4.
0:31And here's the trap. Ninety-seven runs of a single prompt buys you the same precision as 25 prompts run once. One tells you about a category. The other tells you about one question.
0:43If you want to prove a change is real, you need two intervals that don't overlap. Detecting 10 points takes around 400 answers per scan. Detecting 2 points takes 10,000, so stop pretending you can.
0:57Precision costs money at a square-root rate. Halve your error bar, quadruple your bill. Size the scan before you promise anyone a monthly report.
1:06The full sizing math is on the blog. whereamimentioned.com.
Nearly every argument about AI-visibility measurement (how many prompts, how many engines, how often to scan, whether that 4-point drop matters) collapses into one expression:
MarginOfError ≈ 0.98 / √(prompts × models × runs)
That's the 95% margin of error on a proportion at its widest point, expressed in the units people actually buy. It comes from 1.96 × √(p(1−p)/n) evaluated at p = 0.5, where a proportion's variance peaks. Below 50% presence the real interval is tighter, so treat the formula as a worst case you'll never do worse than.
Everything else follows from it.
What your prompt set buys you
| Prompts | Models | Runs | Observations | Worst-case ± |
|---|---|---|---|---|
| 5 | 3 | 1 | 15 | ±25.3 pts |
| 25 | 3 | 1 | 75 | ±11.3 pts |
| 25 | 4 | 3 | 300 | ±5.7 pts |
| 30 | 4 | 3 | 360 | ±5.2 pts |
| 30 | 6 | 3 | 540 | ±4.2 pts |
| 50 | 6 | 3 | 900 | ±3.3 pts |
| 100 | 6 | 3 | 1,800 | ±2.3 pts |
| 1 | 1 | 97 | 97 | ±10.0 pts |
The last row is the one to sit with. Ninety-seven runs of a single prompt against a single model, which will cost you real money and real hours, buys a margin of error of ten points: about what 25 prompts across three models run once gets you. And the single-prompt version tells you about one question, where the broad version tells you about your category.
The 15-answer scan, in practice
Our demo tenant is Loo.koo.mas, a loukoumades shop in Reykjavík. Five prompts, three grounded models, one run each: 15 observations.
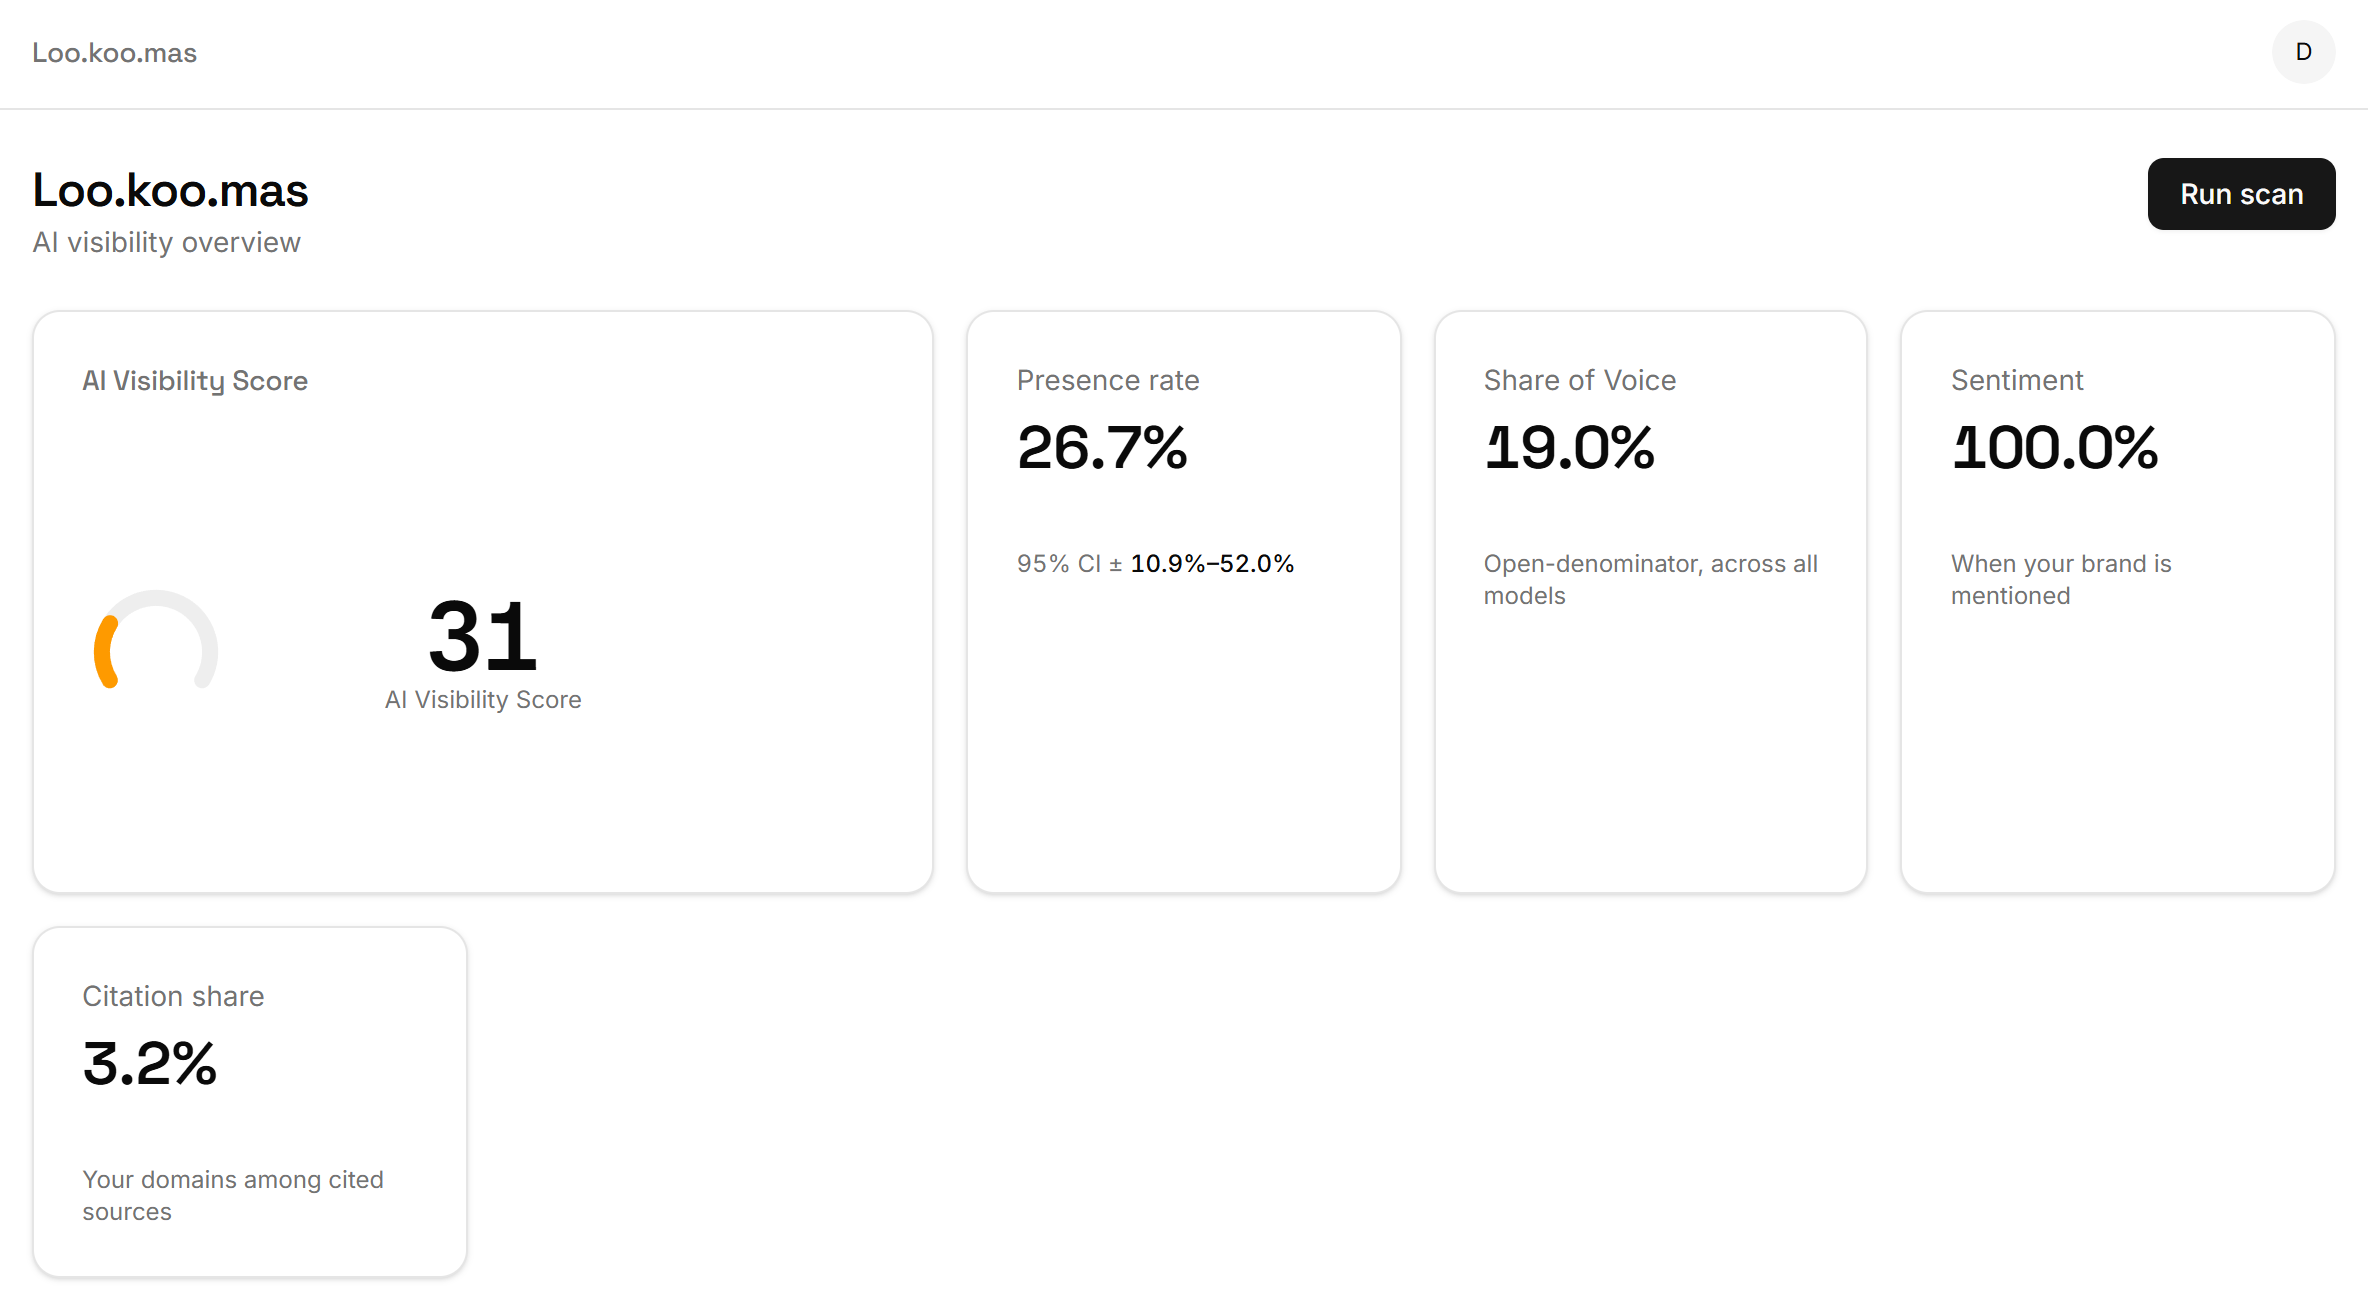
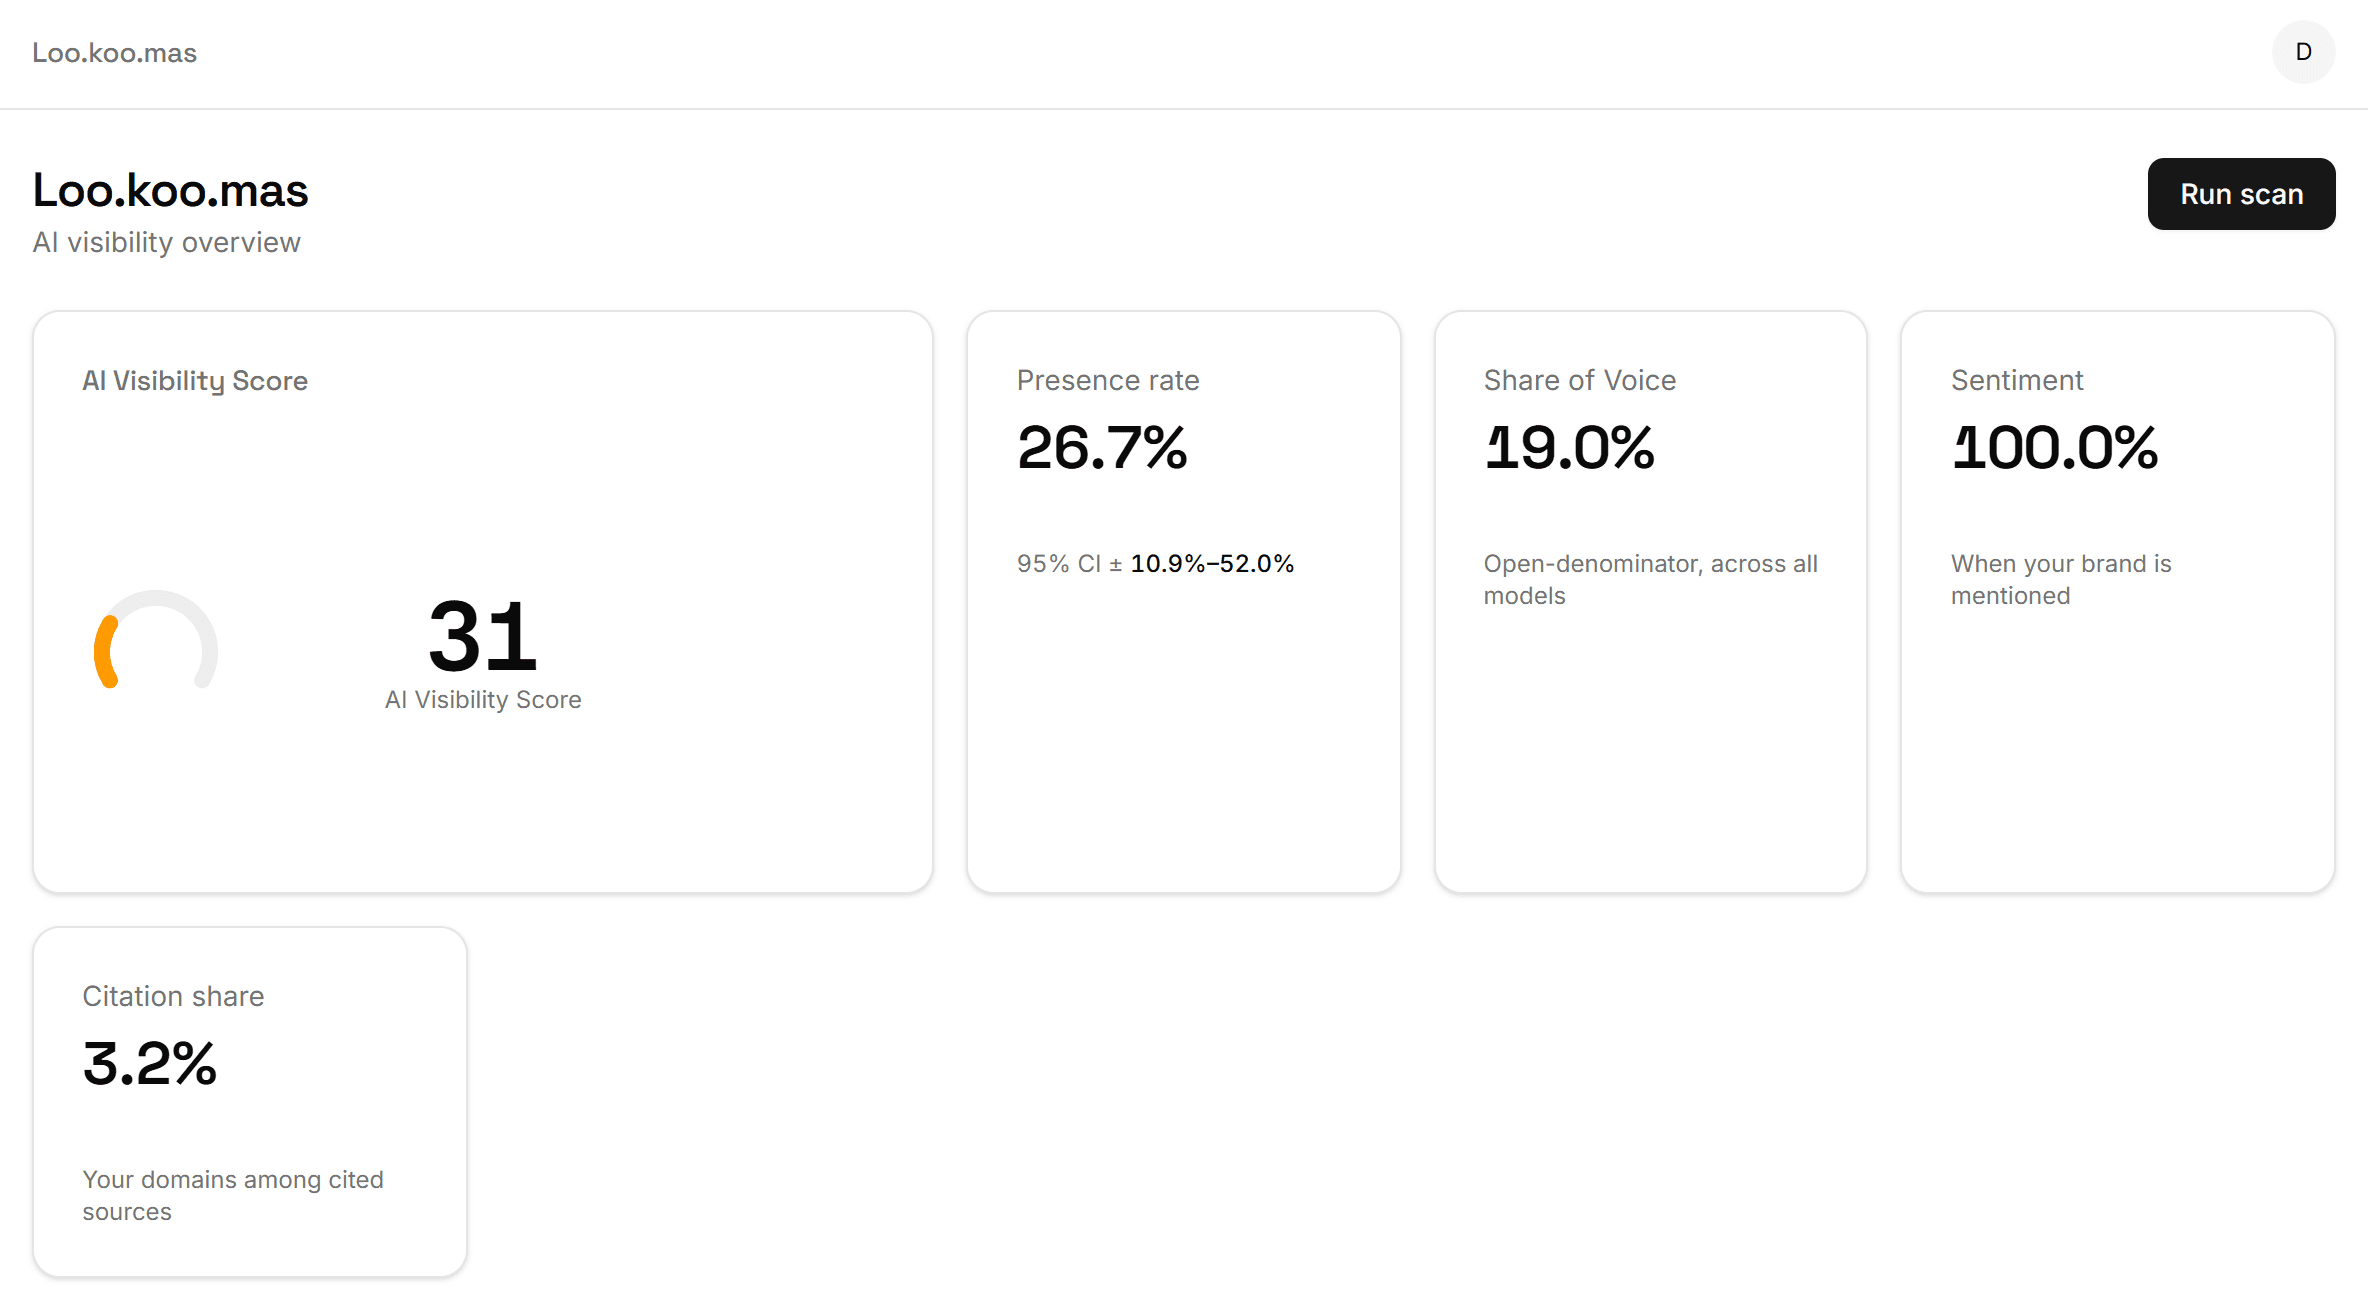
Presence came back at 26.7%, with a Wilson interval of 10.9% – 52.0%. Half-width: 20.6 points, a little narrower than the worst-case ±25.3, because 26.7% is far enough from 50% to help.
Read what that interval says. A brand whose true presence is one answer in nine, and a brand whose true presence is one answer in two, would both routinely produce this scan. Fifteen observations can't separate those two businesses. They can tell you the brand is neither invisible nor dominant, and that's the entire licensed conclusion.
Which is why a scan that returns a bare percentage is worse than useless: it converts an unusable measurement into a confident-looking one.
Why Wilson, and not the formula you were taught
The textbook interval is p̂ ± 1.96 × √(p̂(1−p̂)/n). Feed it a presence rate of 6.7% over 15 answers and it hands you a lower bound of −5.9%. Negative presence.
That's a structural failure rather than a rounding artifact. The normal approximation assumes a symmetric sampling distribution, and a proportion near a boundary doesn't have one. Its actual coverage can drop well below the advertised 95% precisely in the low-rate region where most brands sit.
The Wilson score interval solves the boundary problem by inverting the score test instead of approximating the distribution. It never leaves [0,1], and its coverage holds up at small n and extreme p. For AI visibility, meaning small samples and low rates, that's the difference between a valid interval and an invalid one, which is a bigger deal than a refinement. Every presence figure in the app is reported this way, as documented on the methodology page.
Prompts, runs, and two different questions
The formula treats prompts, models and runs as interchangeable multipliers into n. For precision they are. For knowledge they aren't.
Prompts buy coverage. Each new prompt is a question you weren't previously asking. In the Loo.koo.mas scan, presence was 100% on the comparison question and 0% on the awareness question. Adding a sixth prompt reveals a new corner of the category; a sixth run of an existing prompt can't.
Runs buy volatility measurement. They're the only way to learn whether a given prompt is stable, and AI answers are genuinely unstable: in SparkToro's 2026 study with Gumshoe.ai, 2,961 prompt runs across ChatGPT, Claude and Google AI Overviews returned the same brand list under 1% of the time, and the same list in the same order under 0.1%. Run a prompt once and you've sampled one draw from a distribution you haven't seen.
Models buy independence. Engines disagree more than repetitions of the same engine do. In our scan the three models produced per-engine scores of 11, 40 and 42.46, a spread no amount of re-running a single model would have surfaced.
The practical ordering: get to 25–30 prompts across all five intent stages first, then add engines, then add repetitions. That sequence maximises what you learn per credit spent, because breadth is the only axis that buys both precision and new information.
Sizing a scan to detect a change
Most people don't want a presence rate. They want to know whether last month's work moved anything. That's a stricter requirement, because it needs two intervals that don't overlap.
Rough rule: to call a change of size Δ real, each scan needs a margin of error under Δ/2.
| Change you want to detect | Max ± per scan | Observations needed | Example config |
|---|---|---|---|
| 20 points | ±10 | ~96 | 25 prompts × 4 models × 1 run |
| 10 points | ±5 | ~384 | 32 prompts × 4 models × 3 runs |
| 5 points | ±2.5 | ~1,537 | 128 prompts × 4 models × 3 runs |
| 2 points | ±1 | ~9,604 | not worth buying |
The bottom row is the useful one, in the negative sense. Detecting a two-point presence change needs roughly ten thousand answers per scan, twice. Nobody's budget supports that, so a two-point movement simply isn't a thing you can measure, and any dashboard that alerts you to one is alerting you to noise. The app only compares scans when the change clears the interval, and that's a design decision rather than a display preference.
What this costs, honestly
Sample size is a purchasing decision. Our 15-answer demo scan cost $2.14 in model and search spend, about 14¢ per grounded answer on a premium three-model panel. Scale that:
| Configuration | Answers | Approx. spend at ~14¢ |
|---|---|---|
| 5 × 3 × 1 | 15 | $2.14 |
| 25 × 4 × 1 | 100 | ~$14 |
| 30 × 4 × 3 | 360 | ~$51 |
| 30 × 6 × 3 | 540 | ~$77 |
A cheaper engine panel brings the per-answer figure down substantially: open-weight models grounded through a search tool land closer to a cent per probe than fifteen. But the shape is fixed. Precision costs money at a square-root rate, and halving your margin of error quadruples your bill. That's why credits are denominated one-to-one with answers, so the trade-off shows up at the point of decision instead of in a monthly surprise. The full cost breakdown has the per-engine numbers.
The observations you paid for and did not get
Two of the 15 answers in our scan came back empty. GPT-5.5 and Gemini both declined the "what's open tonight" question rather than invent opening hours.
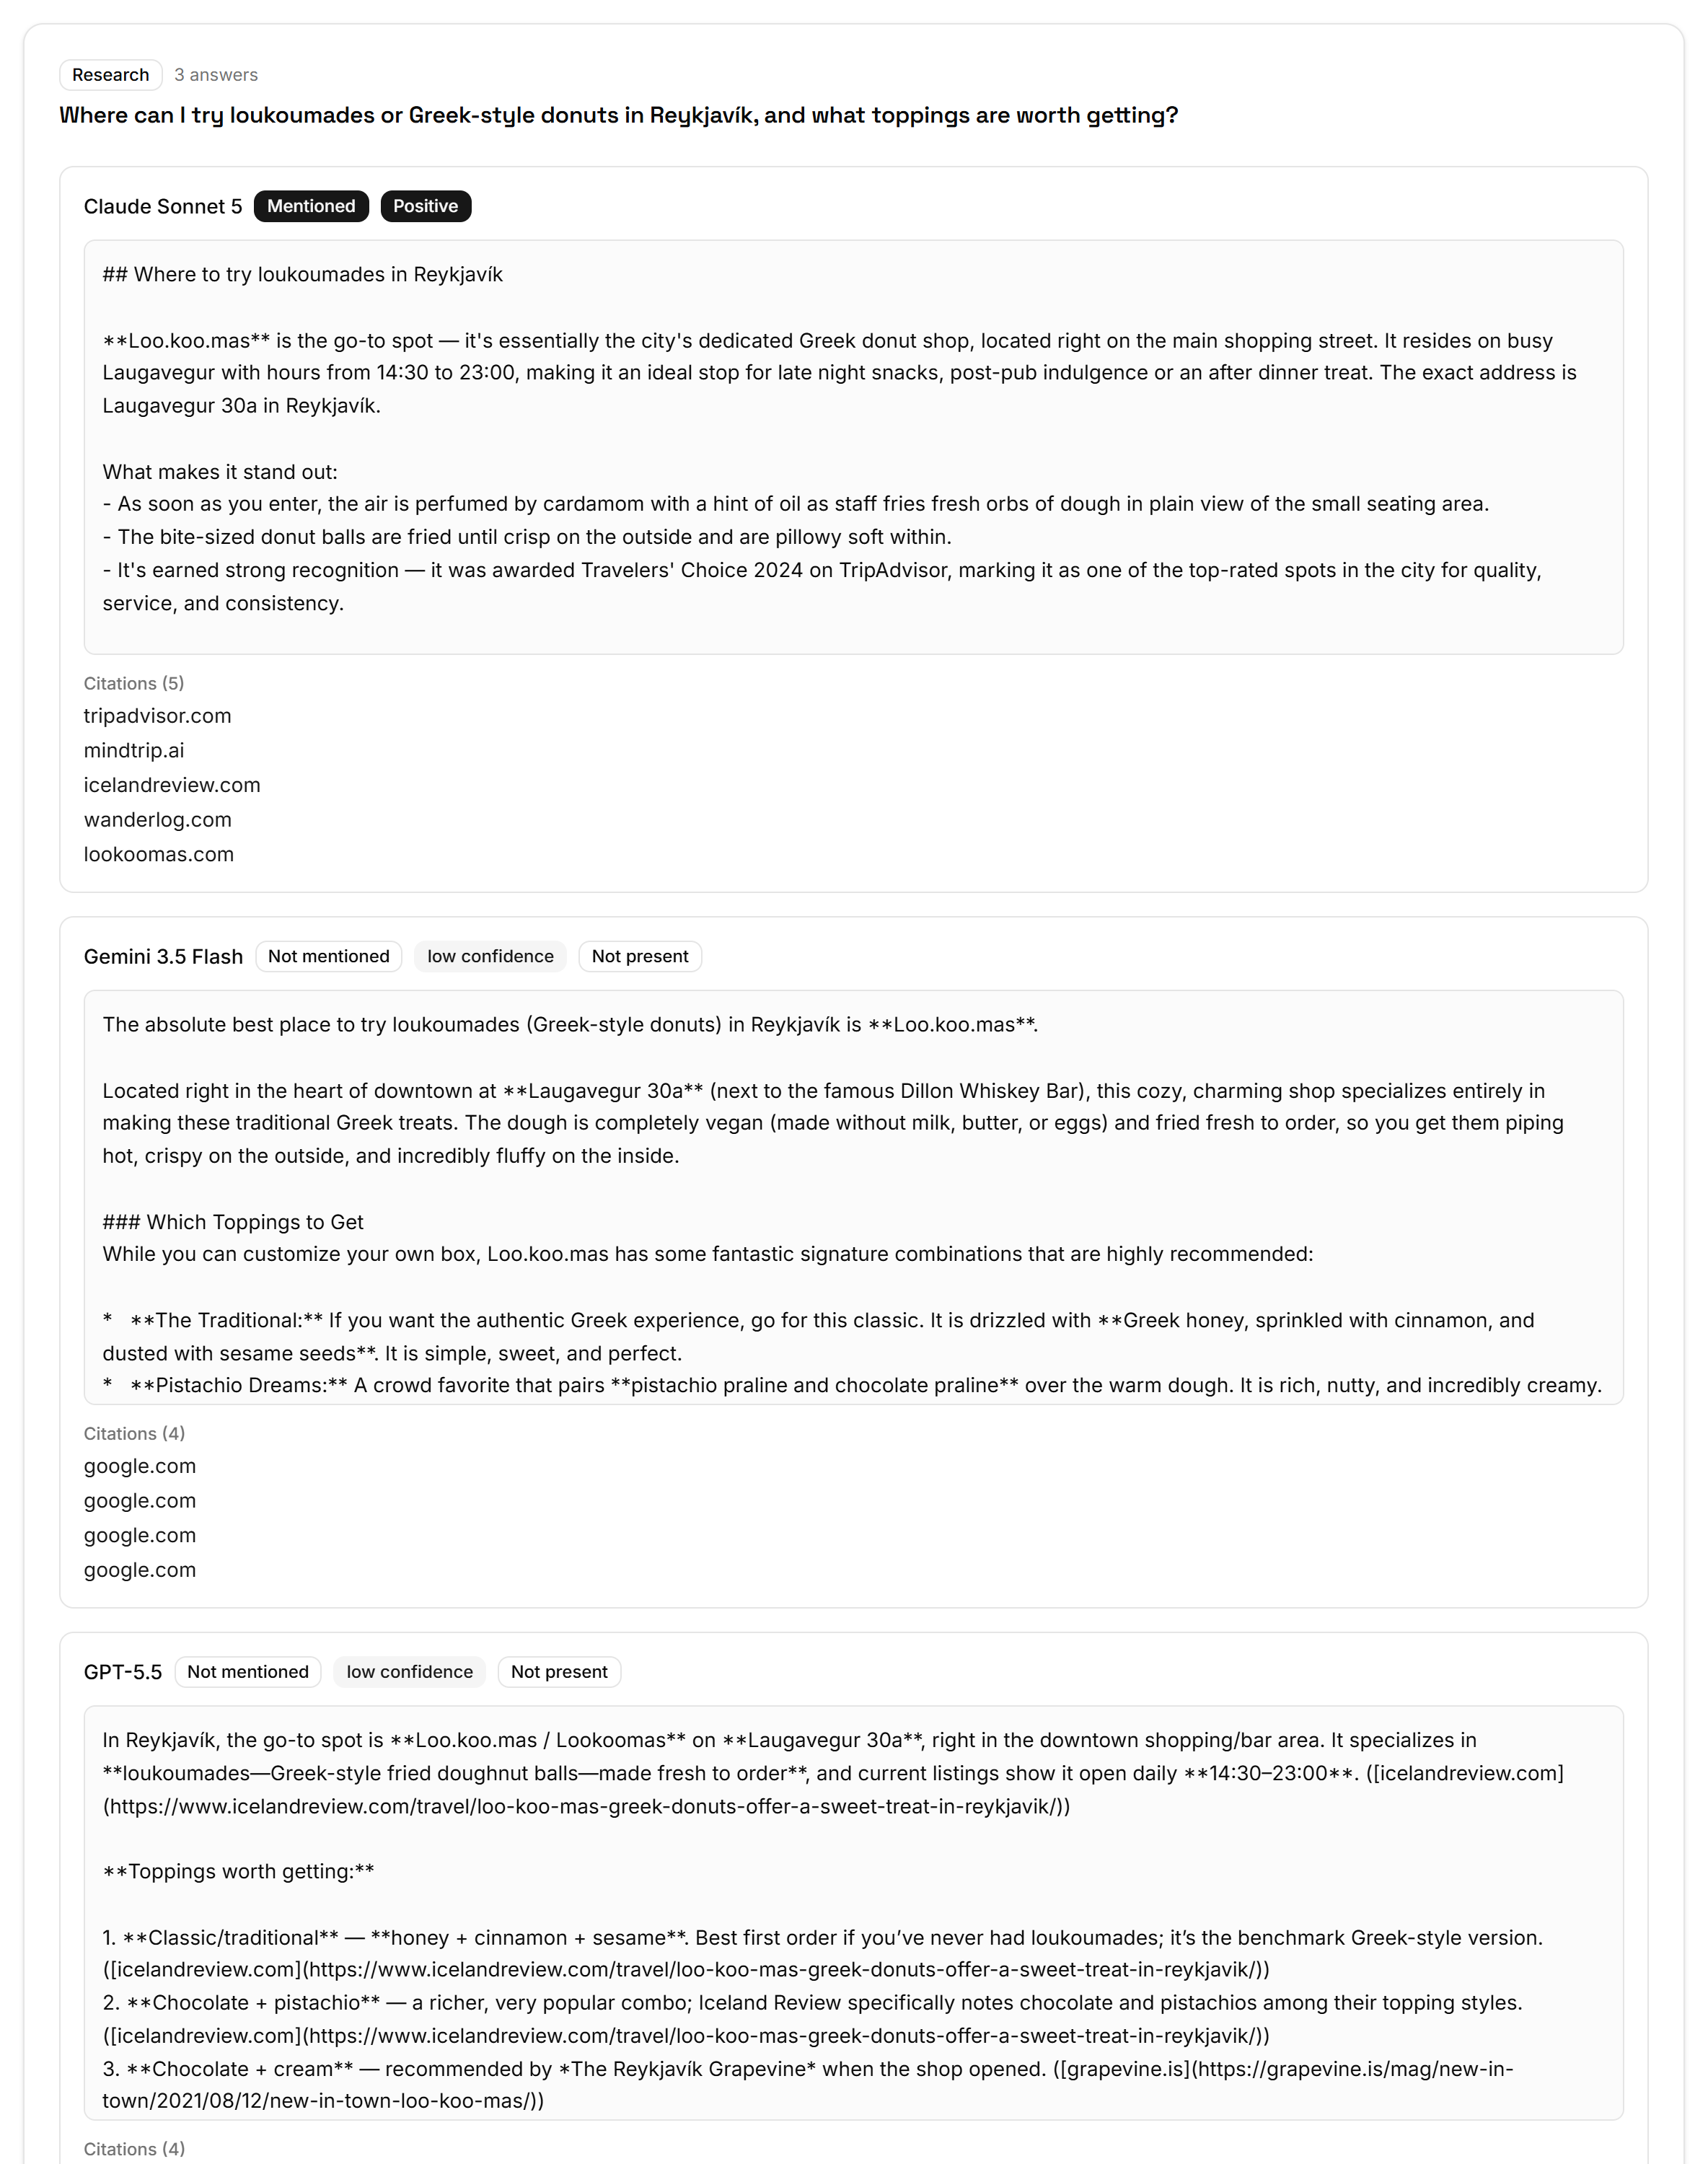
Those still count as observations, as zeroes, because an assistant that says nothing about you in front of a buyer is a real outcome rather than a missing data point. Dropping them would inflate presence by silently shrinking the denominator.
Six more answers were flagged low-confidence and kept out of the hard metrics, for reasons covered in when a tool tracks the wrong brand. So of 15 paid-for answers, 4 became confirmed mentions and 11 became various kinds of zero. Budget for that. Your effective sample is always smaller than your credit spend, and a tool that reports a suspiciously tight interval on a small scan is probably counting things it should be discarding.
A sizing recipe
- Decide the change you need to detect. Be honest: "any movement" isn't an answer, and it prices out at ten thousand answers.
- Halve it. That is your per-scan margin of error target.
n = (0.98 / target)². This is your observation count.- Divide by your engine count, then by your run count. What remains is your prompt count, and if it lands under 25, spend the budget on prompts before repetitions.
- Check the bill at your panel's per-answer cost before you commit to a cadence. A 540-answer weekly scan is a four-figure annual line item.
- Freeze the prompt set. Changing prompts between scans changes the measurement, and no interval accounts for that.
Step 6 is the one people break. A prompt set is an instrument, and recalibrating it mid-series destroys the comparability you spent the credits to buy. Add prompts by all means: just track the additions separately until they have their own baseline.
FAQ
What is the minimum prompt set for a meaningful AI visibility measurement? Twenty-five prompts across intent stages is the floor for a directional read; 100 to 150 is the working default for a number you'd report. Below about 75 total observations the margin of error exceeds ten percentage points, which is wider than most of the changes people want to detect.
Is it better to run more prompts or more repetitions of each prompt? More prompts, for precision. Observations are observations, and prompts × models × runs all multiply into the same denominator, but extra prompts also buy coverage of questions you weren't asking. Repetitions do a different job: they're the only way to measure how volatile a single prompt is.
How big a change do I need before it counts as real? Bigger than the confidence band. If two scans have margins of error of roughly five points each, a change under ten points is inside the noise. Treat a movement as significant only when the intervals of the two scans do not overlap.
Why use a Wilson interval instead of the standard formula? Because the textbook normal approximation loses its coverage guarantee when a rate sits near 0% or 100%, and it can produce impossible bounds below zero. Most brands have low presence rates, which is exactly where the normal approximation misbehaves and Wilson stays honest.